DDO Viewer
Executing the DDO Viewer
The GUI of the DDO Viewer for (post-) processing of entire optimization executions starts by calling the main() of main_ddo_viewer.py in a new terminal (separate from the terminal executing the coordination method itself as detailed in Tutorial > Problem Definition and Algorithm Execution).
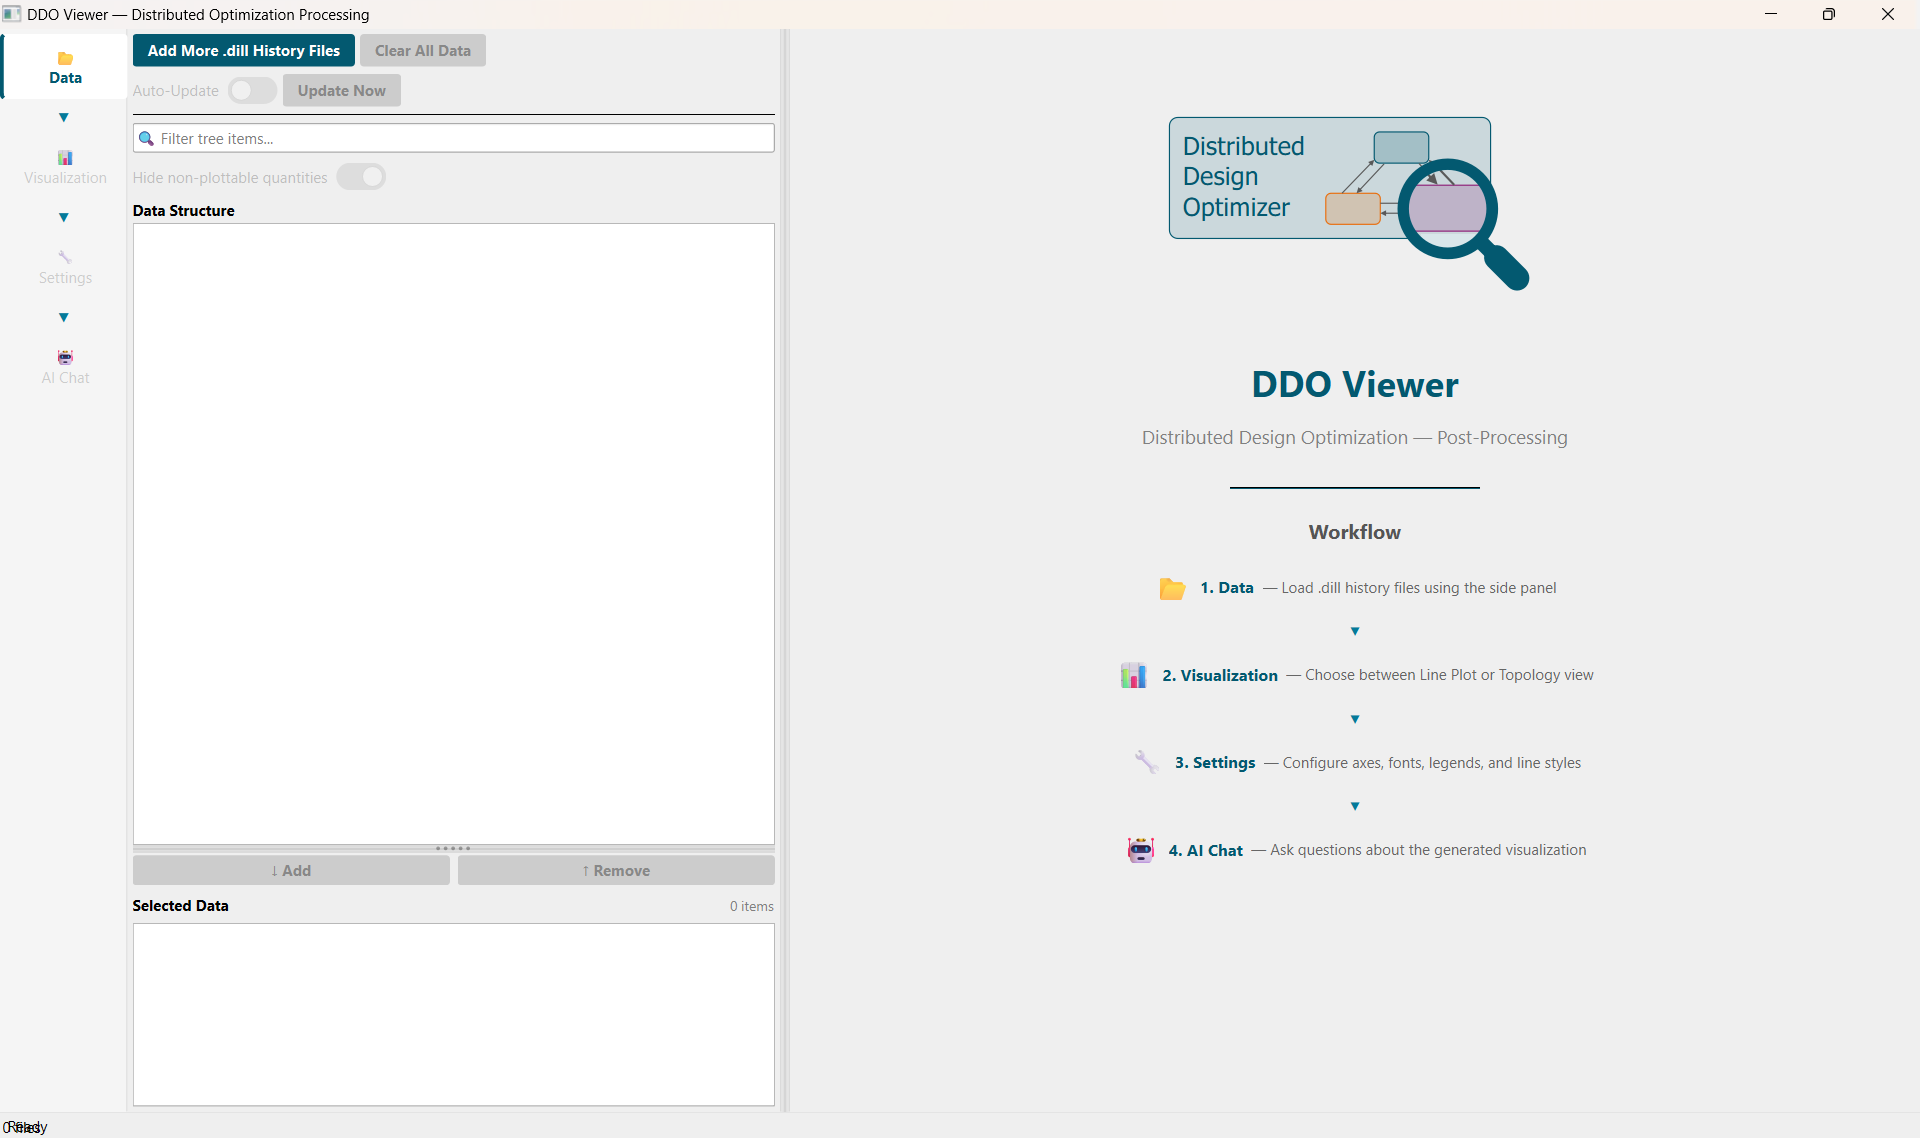
This section covers how to perform (post-) processing and analysis using the GUI in order to gain deeper insights into both algorithm behavior and the solved distributed design optimization problem. A step-by-step guide is illustrated for the SSBJ Example (solved with two different hyperparameter configurations for comparative analysis) below.
1. Data Panel
The DDO Viewer offers various functionalities to analyse and visualize the data logged and stored into .dill files during an optimization execution (see Data Logging). It is also possible to process multiple .dill files from multiple optimization executions.
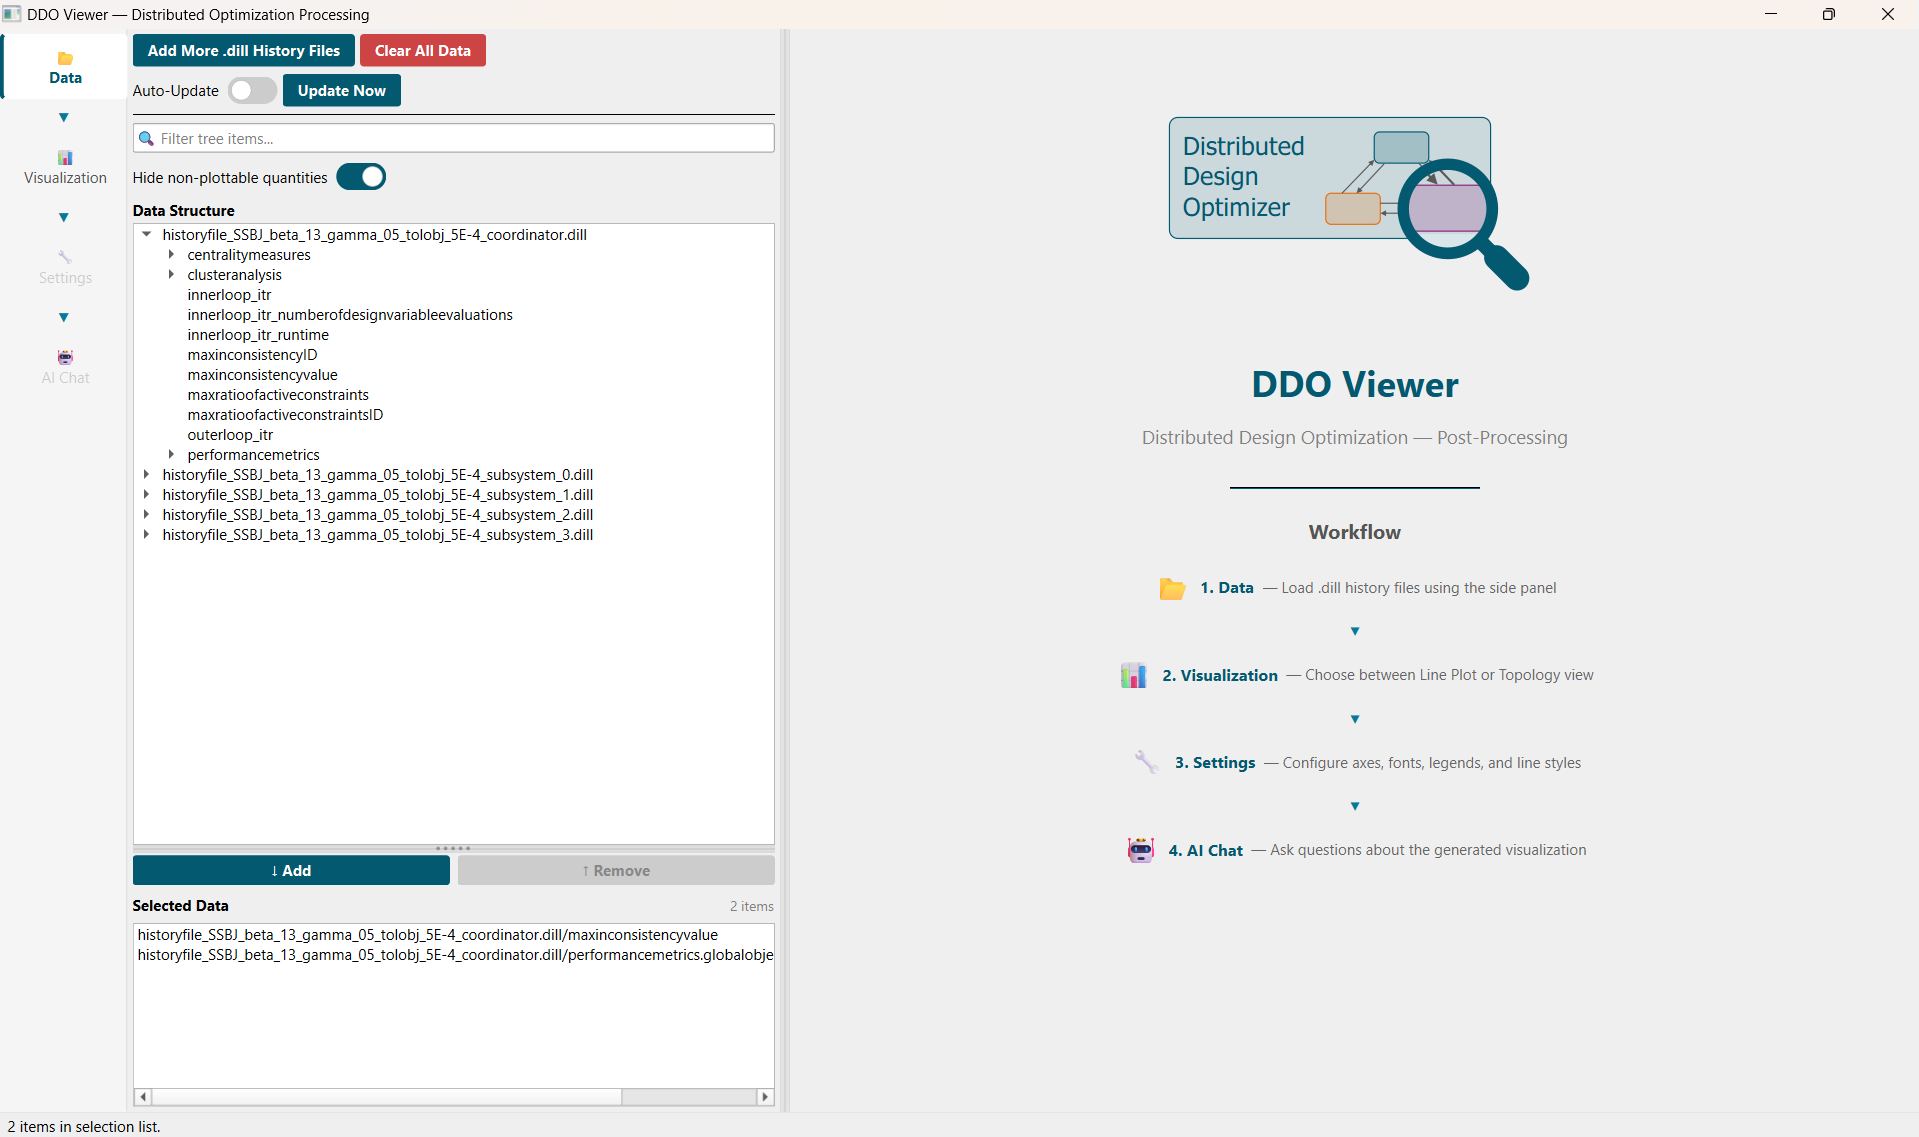
First, the .dill files of interest are selected and loaded into the Data Panel by clicking on the Add More .dill History Files button. The Auto-Update switch and Update Now button allow to refresh any analysis once updated .dill files are stored by the DDO framework during an ongoing optimization execution. This allows to process the coordination during runtime.
As detailed in Data Logging, Coordinator, LocalSubSystemBasis and ControllerSubSystemBasis store their relevant information into .dill files. Each .dill file contains a queue of typed history entry snapshots — one per inner loop iteration — namely CoordinatorHistoryEntry for the coordinator, and LocalSubSystemHistoryEntry / ControllerSubSystemHistoryEntry for the subsystems.
The Data Structure window lists the plottable quantities stored in the selected .dill files. These quantities are discovered automatically from the fields of the history entry objects. The quantities of interest are selected by using the Add button.
As an example, the coupling constraint violation \({}^{1}_{0}\)\(c\) (All-At-Once Problem Formulation and Decomposition) between subsystem 0 and 1 is selected in the following illustration.
2. Visualization Panel
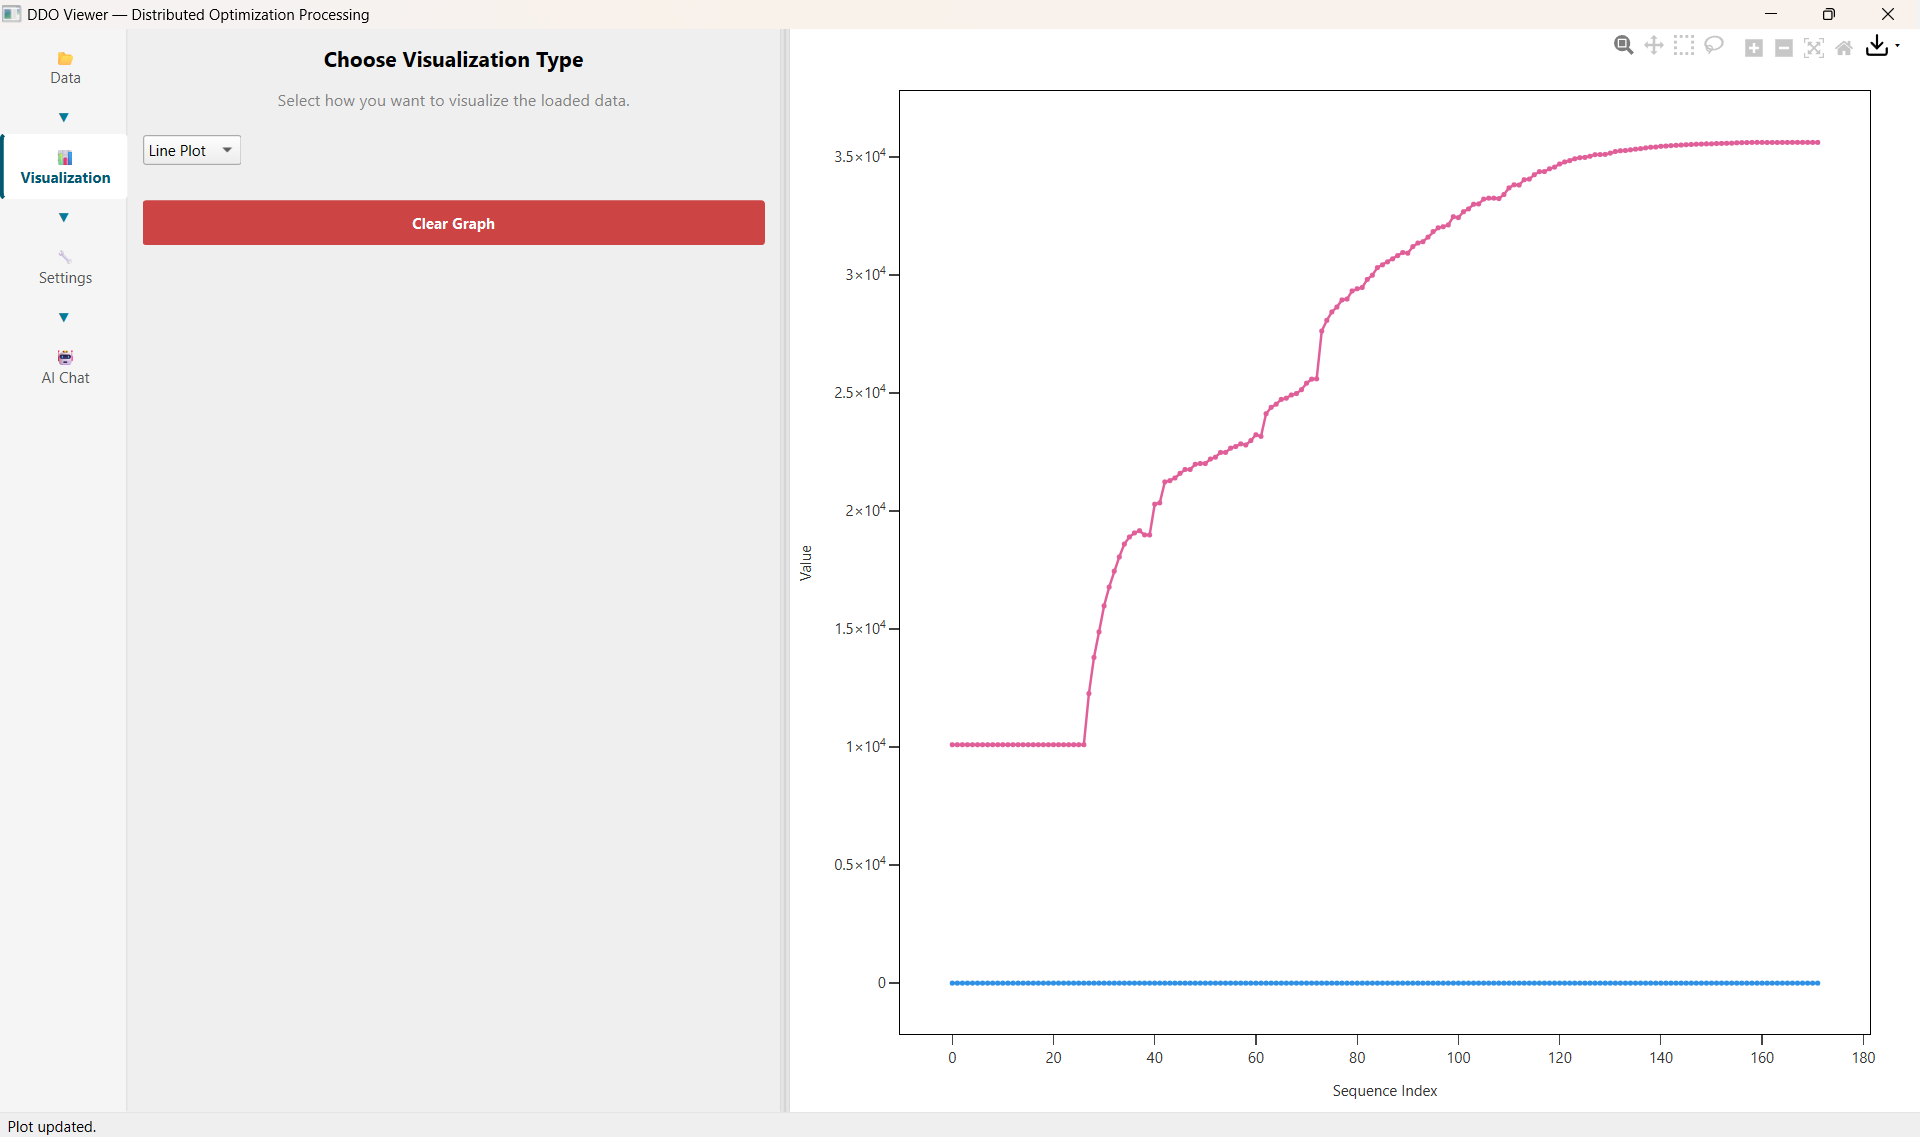
Having selected .dill files in the Data Panel, the Visualization Panel offers different analysis graphs. Currently, only the Line Plot visualization is available. Upon selection, the corresponding plot is shown on the right of the GUI.
3. Settings Panel
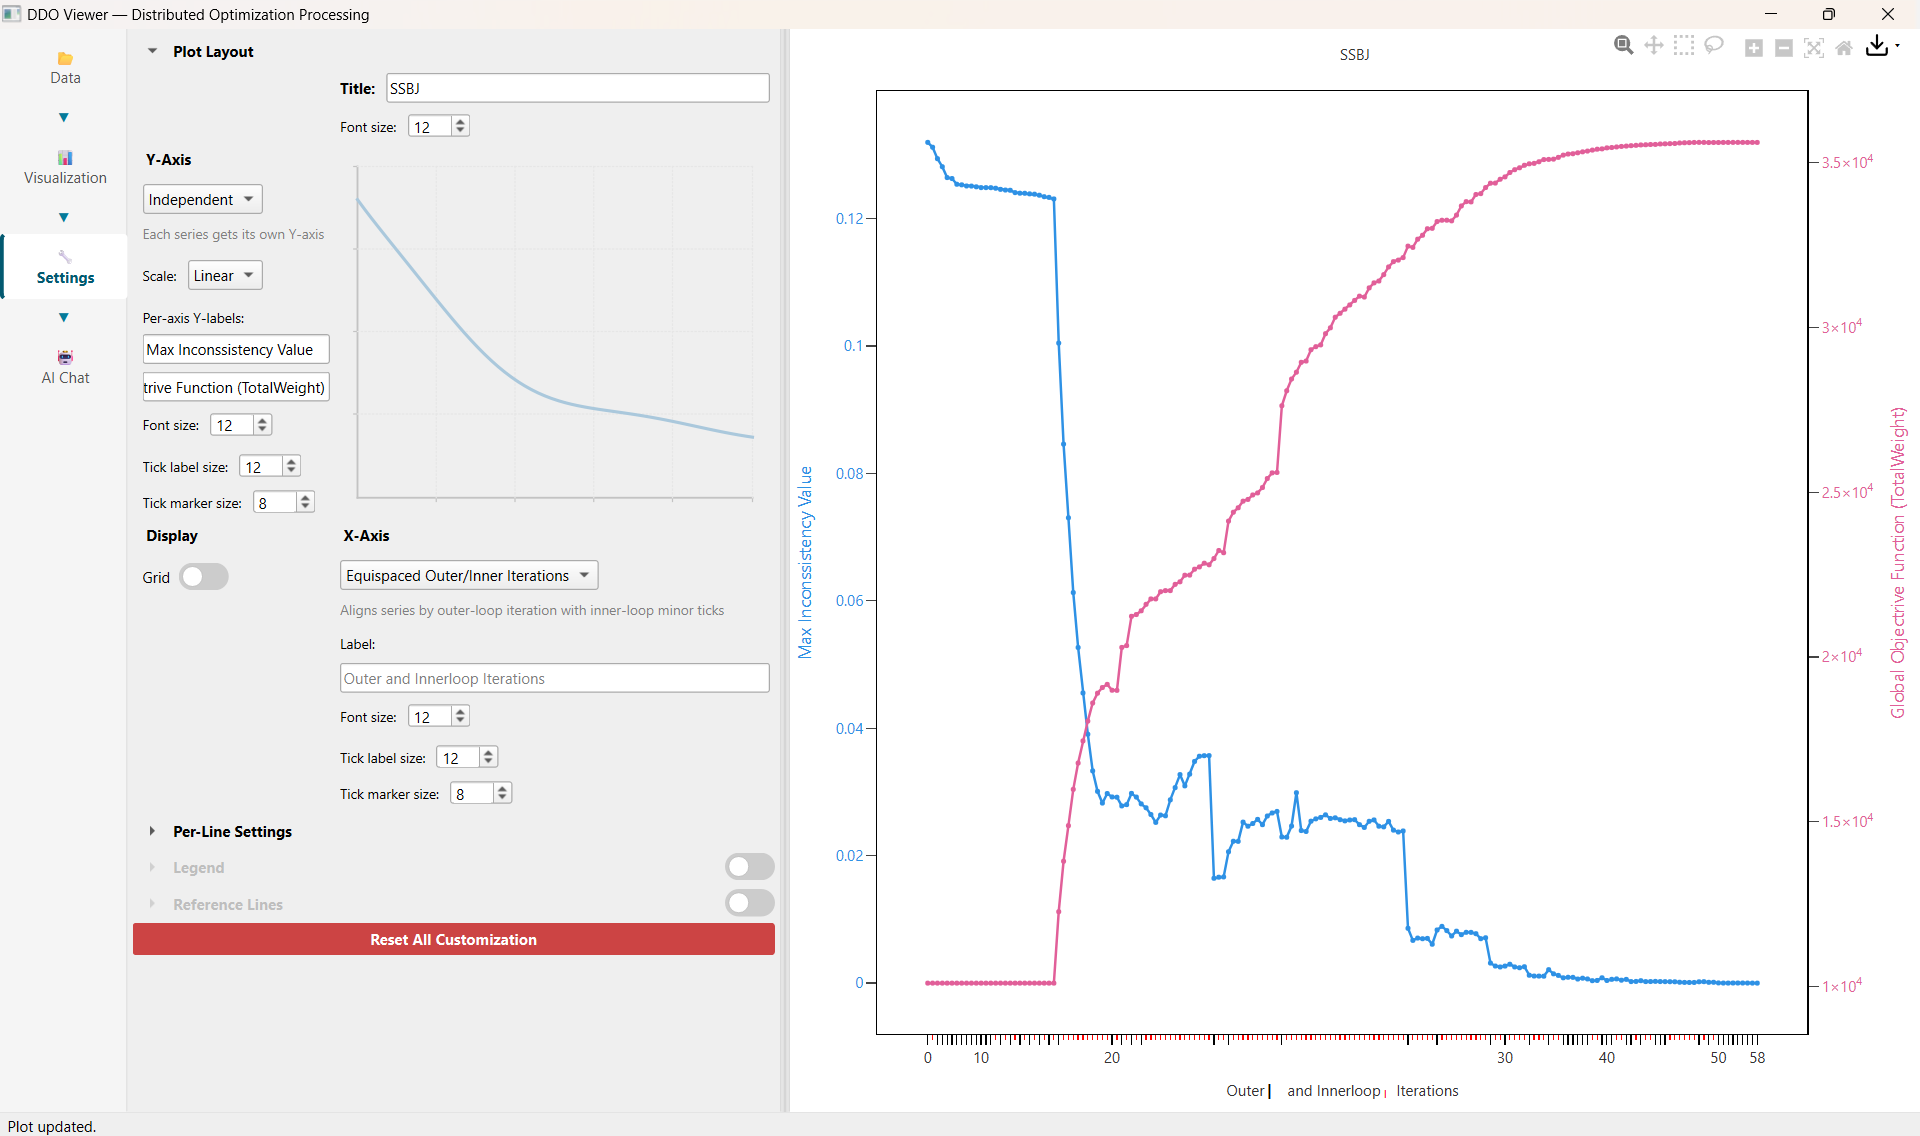
Depending on the chosen Visualization type (Line Plot in this case), the Settings Panel offers various further options and customizations to gain further insights. This includes various options for the Y- and X-Axis configuration as illustrated below.
4. AI Chat Panel
TODO